Interactive maps
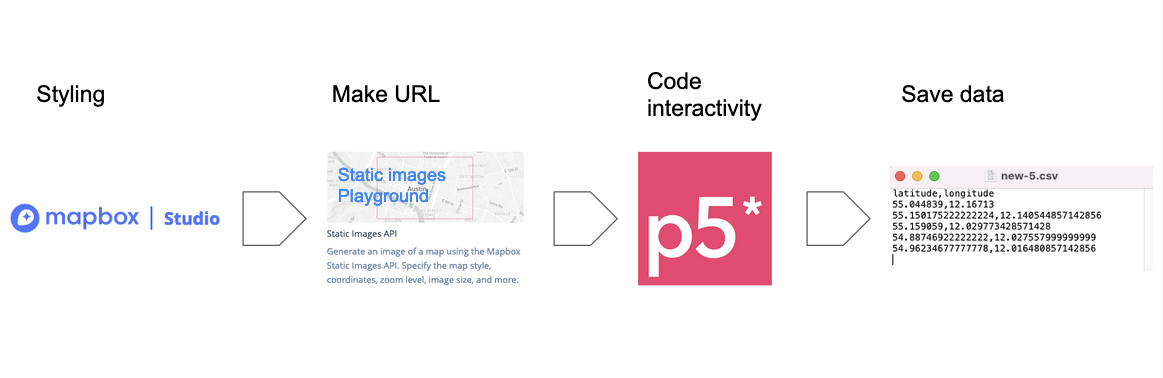
Digital interactive maps have become a powerful tool for communication and citizen engagement. This guide walks you through two examples and workflows on how to make interactive maps with Mapbox and p5js.
We will go through the basic functionalities and styling options of Mapbox Studio and learn how to use p5js to add interactive elements. Mapbox Studio is a web-based tool for styling maps and creating geo-based data. p5js is a javascript library for creative coding.
In the first example we will work with static maps and interactivity. We will style a simple map on MapBox Studio and use p5js to program a simple interactive map for digital citizen participation, where the user can add elements to the map.
In the second example we will work with Tile Maps, how to create geo-data on Mapbox Studio and mappa.js, a javascript library for handling Mapbox GL JS maps. We will design a map with points of interest in a local area.
Table of contents
- Mapbox Styling
- p5js
- User Input - Example 1
- Points of Interest - Example 2
- Share your map
- Secure your keys
Webinar - Interactive maps with Mapbox Studio and p5js
In this webinar we present and go through this manual
Mapbox Styling
You need to make a Mapbox account and be logged in. Mapbox is not a free service but they have a generous free tier that is enough for prototyping.
Start by styling a map on Mapbox Studio that matches the design of your project. Go trough mapbox's own guide and get inspired by their styles library.
How to create a custom style on Mapbox Studio: https://docs.mapbox.com/help/tutorials/create-a-custom-style/
https://docs.mapbox.com/studio-manual/guides/Style inspiration: https://www.mapbox.com/gallery/
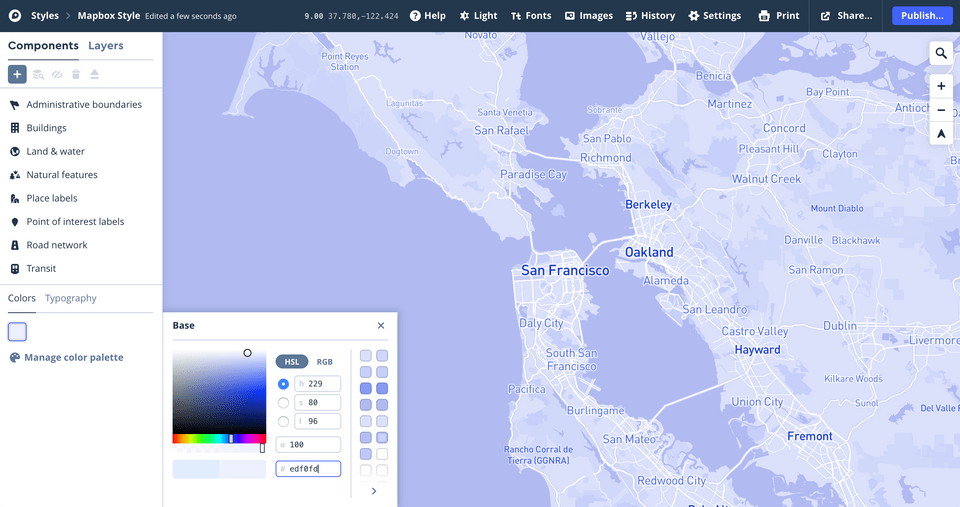 Screen shoot from Mapbox Studio. From https://docs.mapbox.com/help/tutorials/create-a-custom-style/
p5js
To add interactivity we will use p5.js. A JavaScript library for creative coding, with a focus on making coding accessible and inclusive for artists, designers, educators, beginners, and anyone else! p5.js is free and open-source.
Here a list of resources to learn p5js:
https://p5js.org/learn/
https://p5js.org/reference/
https://www.youtube.com/playlist?list=PLRqwX-V7Uu6Zy51Q-x9tMWIv9cueOFTFA
https://learn.hobye.dk/development/p5js/basics
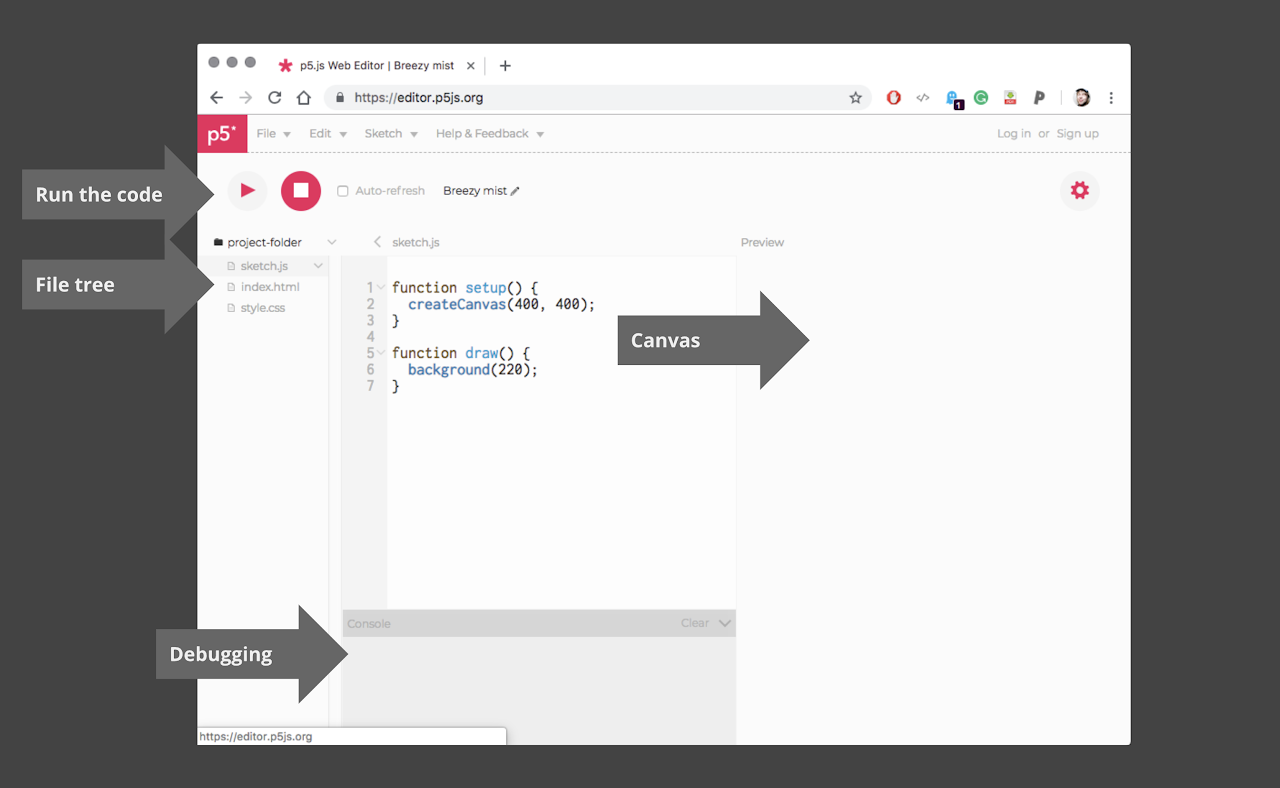 Screen shot from p5Js IDE. From: https://learn.hobye.dk/development/p5js/basics
User Input - Example 1
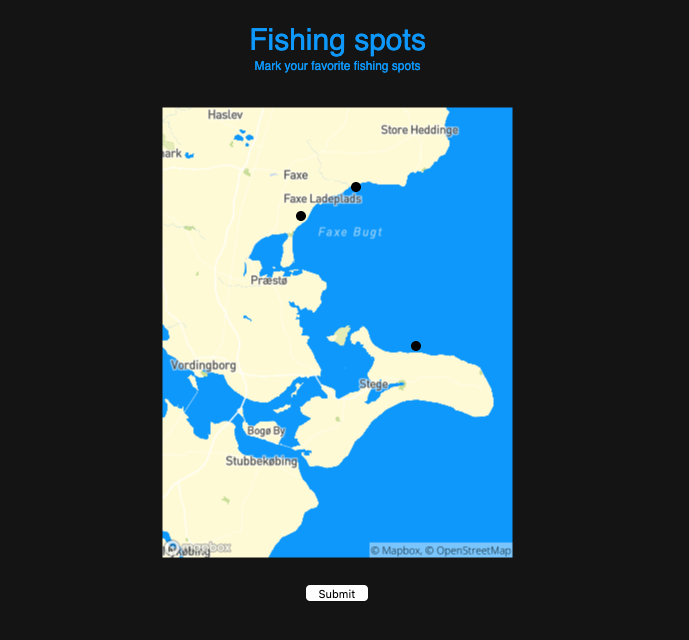
This is what we want to create. A map where the user can add dots, and submit the data.
Full code here: https://editor.p5js.org/saradaug@gmail.com/sketches/YmMD_QwLx
In this example we will use static maps. Static maps are standalone images that can be displayed on web and mobile devices without the aid of a mapping library or API. They look like an embedded map without interactivity or controls.
Workflow
Part I - Getting the map ready
- After styling your map on Mapbox Studio: Publish your style (top right corner). Make your style public and find your style URL - on the share menu (top right corner).
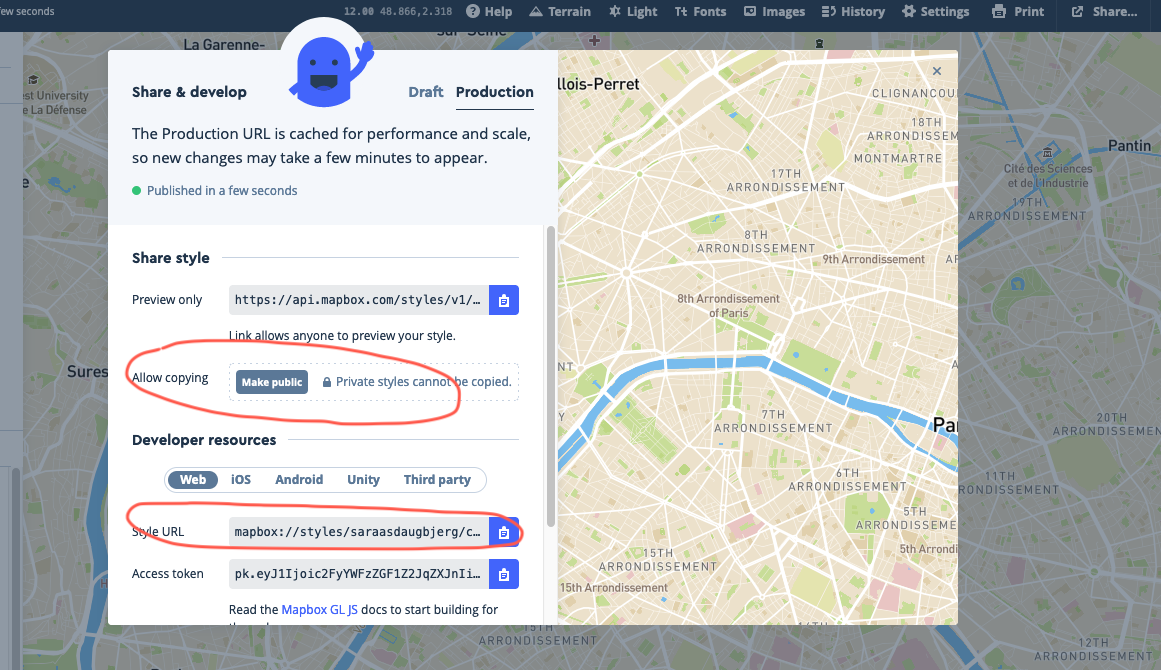 Screen shot from Mabox Studio / Share menu
- Go to https://docs.mapbox.com/playground/static/
Use mapbox's Static Map Playground to enter values for each parameter (style, width & height) and position the map.
- Copy your style URL and paste it into the Static Map playground.
- Adjust width, height and zoom so it fits your needs.
- Make sure you choose "bounding box" for position. The generated Request URL will hold data on bounding box coordinates of your map. This will later be used to calculate the coordinates of the users input.
- Note the request URL changes when you change your parameters. The information in this url is what tells Mapbox which map to retrieve upon your request. If you change your style it will automatically be updated on your p5js script.
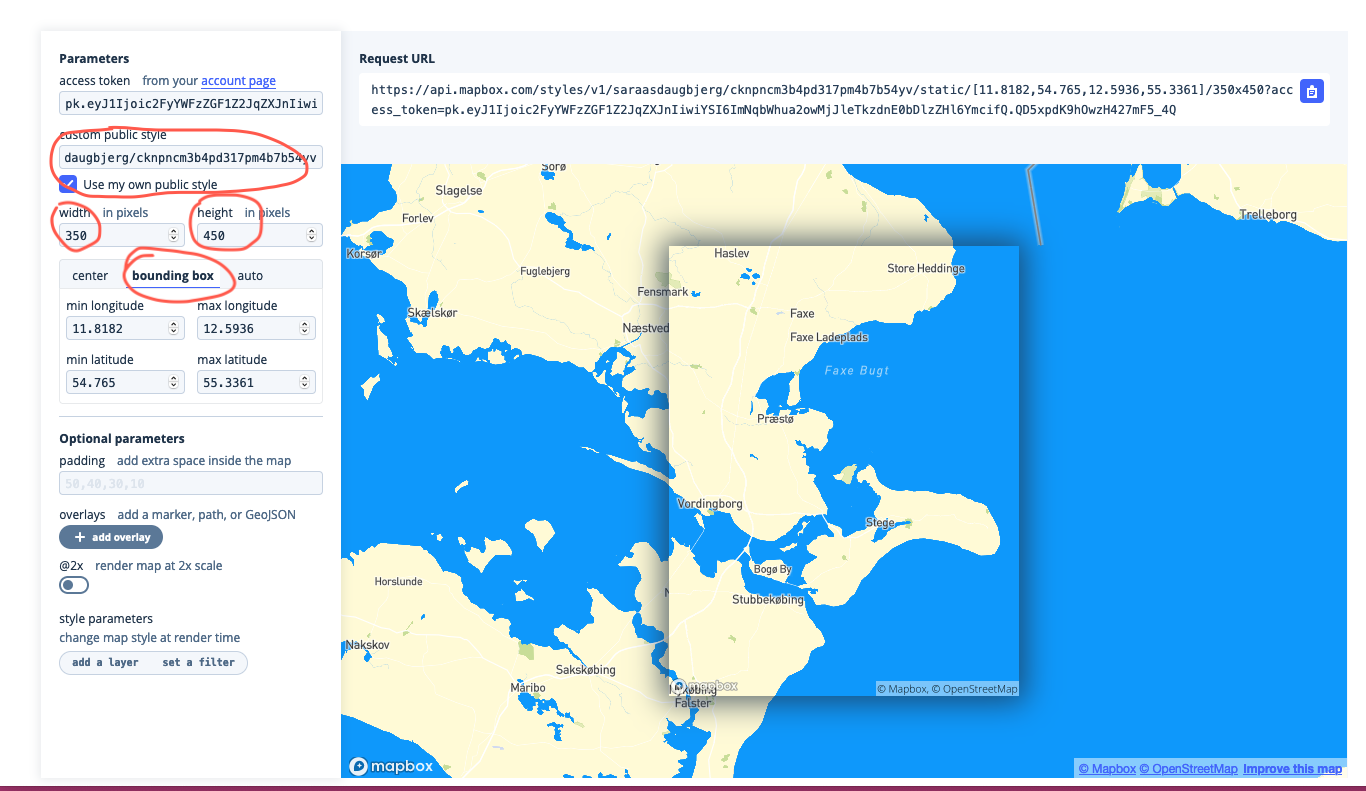 Screen shot from Static Map Playground
Part II - Add interactivity
Full code: https://editor.p5js.org/saradaug@gmail.com/sketches/YmMD_QwLx
You can make a copy to yourself by saving it, while logged in.
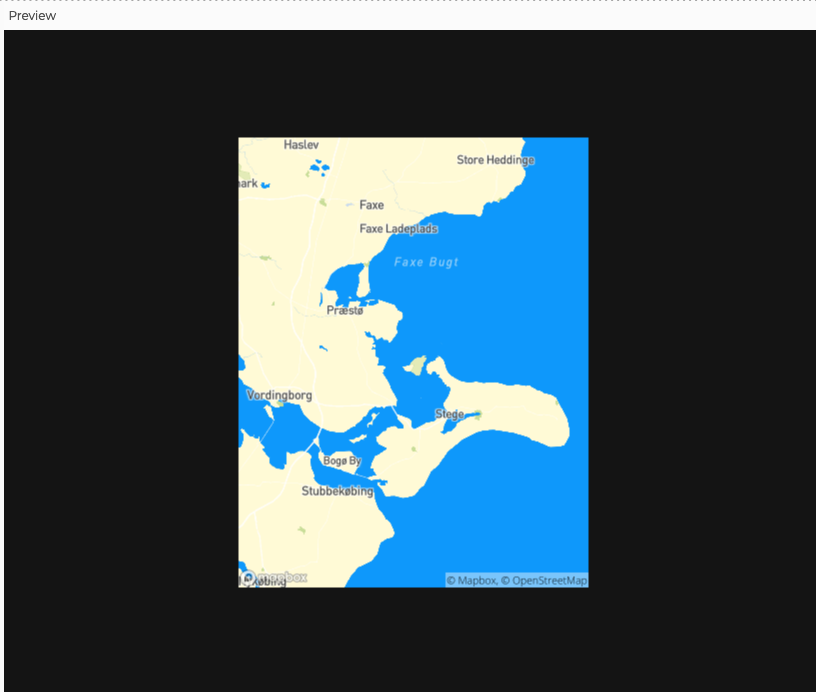
- Integrate your Static Map in p5js
- The map is loaded as an image. See reference for images: https://p5js.org/reference/#/p5/image
// Change to your Request URL
var mapUrl = "https://api.mapbox.com/styles/v1/saraasdaugbjerg/cknpncm3b4pd317pm4b7b54yv/static/[11.8182,54.765,12.5936,55.3361]/350x450?access_token=pk.eyJ1Ijoic2FyYWFzZGF1Z2JqZXJnIiwiYSI6ImNqbWhua2owMjJleTkzdnE0bDlzZHl6YmcifQ.QD5xpdK9hOwzH427mF5_4Q";

var myMap;

function preload(){
  myMap = loadImage(mapUrl);
}

function setup() {
  createCanvas(windowWidth, windowHeight); //responsive
  background(20);
  imageMode(CENTER);
  image(myMap, windowWidth/2,windowHeight/2);
}

function draw() {

}
Output:
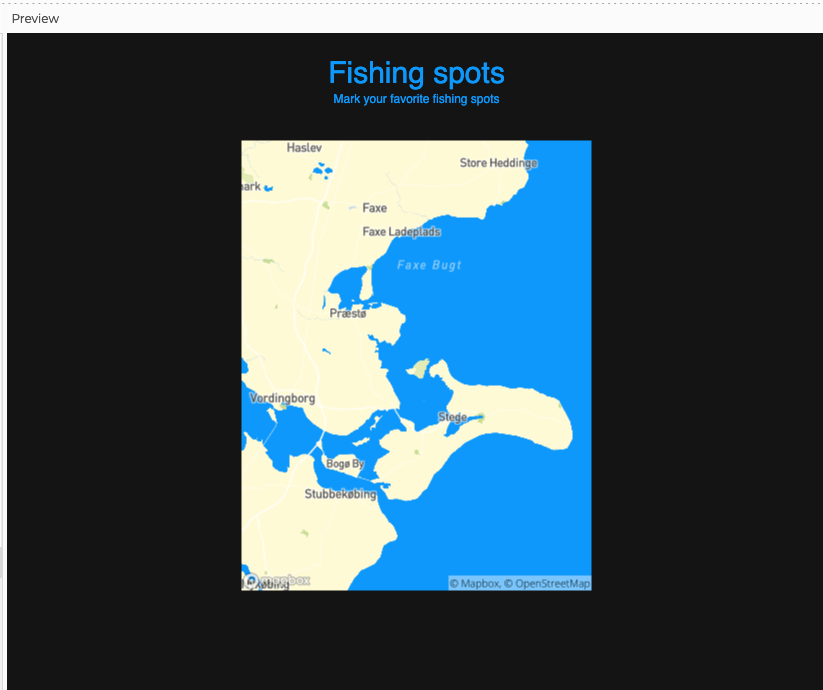
- Add some info text to the webpage.
Reference for text: https://p5js.org/reference/#/p5/text
function setup() {
  createCanvas(windowWidth, windowHeight); //responsive
  background(20);
  imageMode(CENTER);
  image(myMap, windowWidth/2,windowHeight/2);

  textAlign(CENTER);
  textSize(30);
  fill('#0e98fb');
  text("Fishing spots", windowWidth/2, 50);
  textSize(12);
  text("Mark your favorite fishing spots", windowWidth/2, 70);

}
Output:
- Add user input
- We want the user to leave dots on the map and be able to store that data for later use.
- The dots will be instances of a class called Dot. Every instance of this class will be a new object with a x and y coordinate, radius and color and a show() method. To better understand classes and objects watch the following videos: https://thecodingtrain.com/beginners/p5js/index.html from #6.1 - Introduction to OOP with ES6 to #7.5 - Removing objects from array.
- Create a new file and called it dot.js. Copy the following code into the file.
class Dot {
  constructor(x, y, r, color) {
    this.x = x;
    this.y = y;
    this.radius = r;
    this.color = color;
  }

  show() {
  noStroke();
  fill(this.color);
  ellipse(this.x, this.y, this.radius);

  }
}
- Add the dot.js script to your index.html file, by adding the following line into your html-body:
  <body>
    <script src="sketch.js"></script>
    <script src="dot.js"></script>
  </body>
- Use the build-in mousePressed() function to make a new instance of Dot every time the mouse is pressed and store every instance in an array called dots. Every dot will need to have a x, y, radius and color.
- First, you need to define an array in the beginning of your program
var dots = [];
- For every time the mouse is pressed create a new dot, show it and store it in the dots array:
function mousePressed(){

  var dot = new Dot(mouseX,mouseY,10, color(0)); //creates a dot object
  dot.show(); //draws the ellipse
  dots.push(dot);  // adds dot to the dots array

}
Finally you will want a add a submit button, to save the data.
- Reference for creating a button: https://p5js.org/reference/#/p5/createButton
  btnSaveInput = createButton('Submit');
  btnSaveInput.position(windowWidth / 2 - btnSaveInput.width / 2, windowHeight - 80);
  btnSaveInput.mousePressed(saveInput);
Final output:
Function to save the user input:
Find coordinates on the Request Url and extract them
For every dot, convert the x and y to latitude and longitude. In this example I'm using the map function that re-maps a number from one range to another, not considering the curvature of the earth. This is not that problematic in a small scale using web Mercator projection. If you need to convert from one projection to another, you can use this library: https://github.com/proj4js/proj4js
Save the input data. In this example we are storing the data in a table and save it locally as csv-file but the most logic thing to do would be to submit the data to a server. You could use firebase (server as service) to store your data. See how here: https://www.youtube.com/watch?v=JrHT1iqSrAQ
function saveInput() {

  //Make a table with two columns
  dataTable = new p5.Table();
  dataTable.addColumn('latitude');
  dataTable.addColumn('longitude');

  //Extract coordinates from staticmap
  var split1 = split(mapUrl, '/');
  var split2 = split(split1[8], '[');
  var split3 = split(split2[1], ']');
  var urlCoord = split(split3[0], ',');

  //Calculate the bounderies of the map image
  var mapPosXmin = (windowWidth / 2) - (myMap.width / 2);
  var mapPosYmin = (windowHeight / 2) - (myMap.height / 2);
  var mapPosXmax = (windowWidth / 2) + (myMap.width / 2);
  var mapPosYmax = (windowHeight / 2) + (myMap.height / 2);

  //Iterate trough the dots array and convert x and y to lat and long.
  for (let i = 0; i < dots.length; i++) {

    var pointLat = map(dots[i].y, mapPosYmax, mapPosYmin, float(urlCoord[1]), float(urlCoord[3]));
    var pointLng = map(dots[i].x, mapPosXmax, mapPosXmin, float(urlCoord[2]), float(urlCoord[0]));

    // Save it as a new row to the table.
    var tableRow = dataTable.addRow();
    tableRow.setString('latitude', pointLat.toString());
    tableRow.setString('longitude', pointLng.toString());
  }
  //Save table as a csv file locally
  saveTable(dataTable, 'new.csv');

  //to be implented later
  // save data to server Fire Base:
  //https://www.youtube.com/watch?v=JrHT1iqSrAQ -

}
Full code here: https://editor.p5js.org/saradaug@gmail.com/sketches/YmMD_QwLx
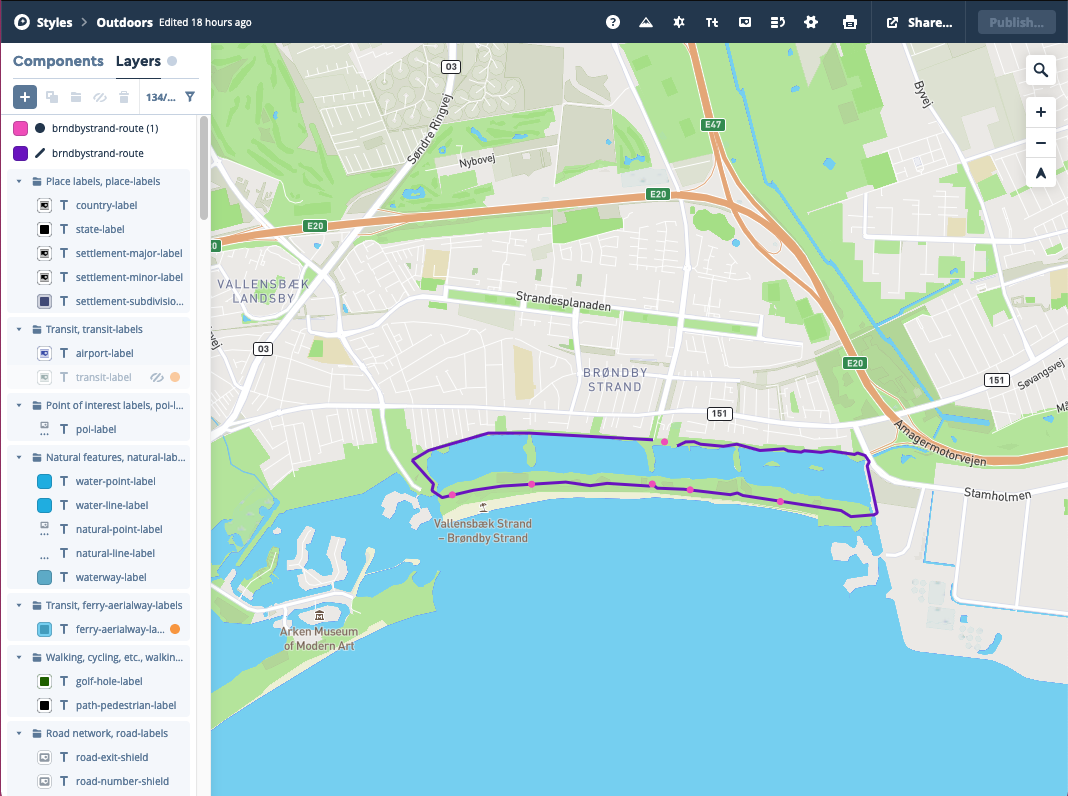
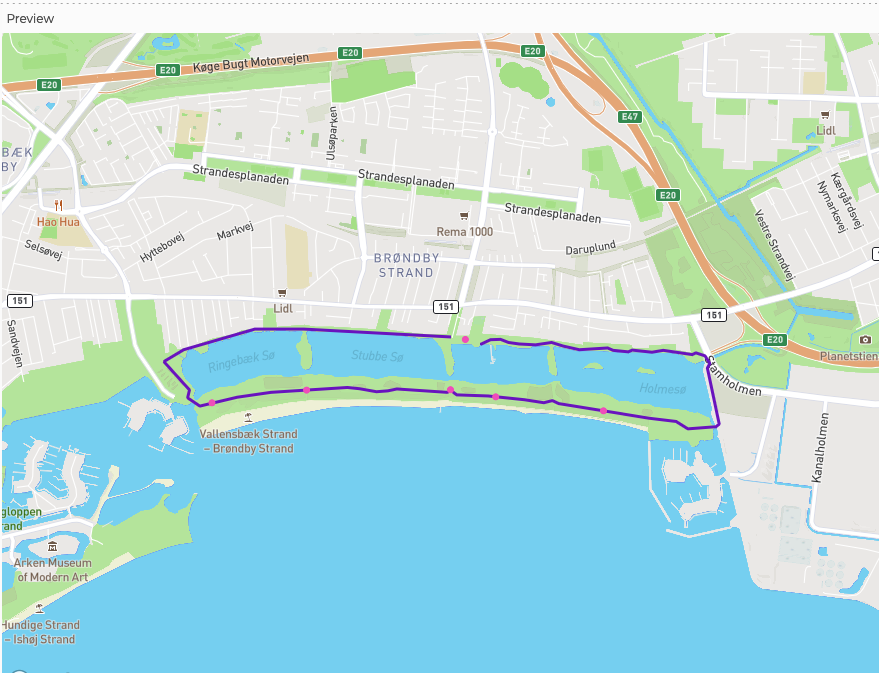
Points of Interest - Example 2
This is what we want to create. A map with Points of Interest and information about them.
Full code her:
https://editor.p5js.org/saradaug@gmail.com/sketches/Oj-VPNUeG
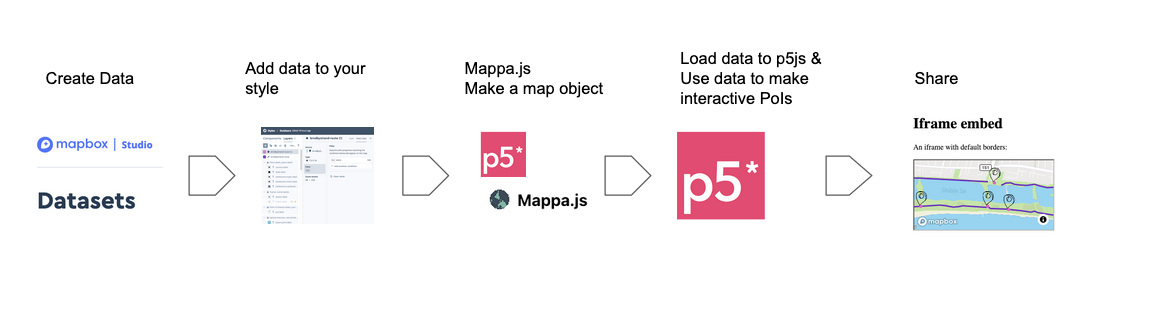
In this example we use Mapbox Web GL JS API (https://docs.mapbox.com/mapbox-gl-js/api/) to render an interactive map as vector tile. First we will create the route and the PoI as data on Mapbox Studio, and use that data on p5js to add interactivity.
We will use mappa.js, a library for Mapbox GL JS - p5js integration. It hasn't been updated since 2018 and it's therefore not fully functional as it is, but the best I could find so far. Make a copy of mappa.js from my github, to get an updated version of mappa.js.
You can also get to know the Mapbox API and integrate it yourself.
Workflow
Part I - Add data to the map
- How to create and edit data on Mapbox Studio:
https://docs.mapbox.com/help/tutorials/create-and-edit-data-in-studio-video/
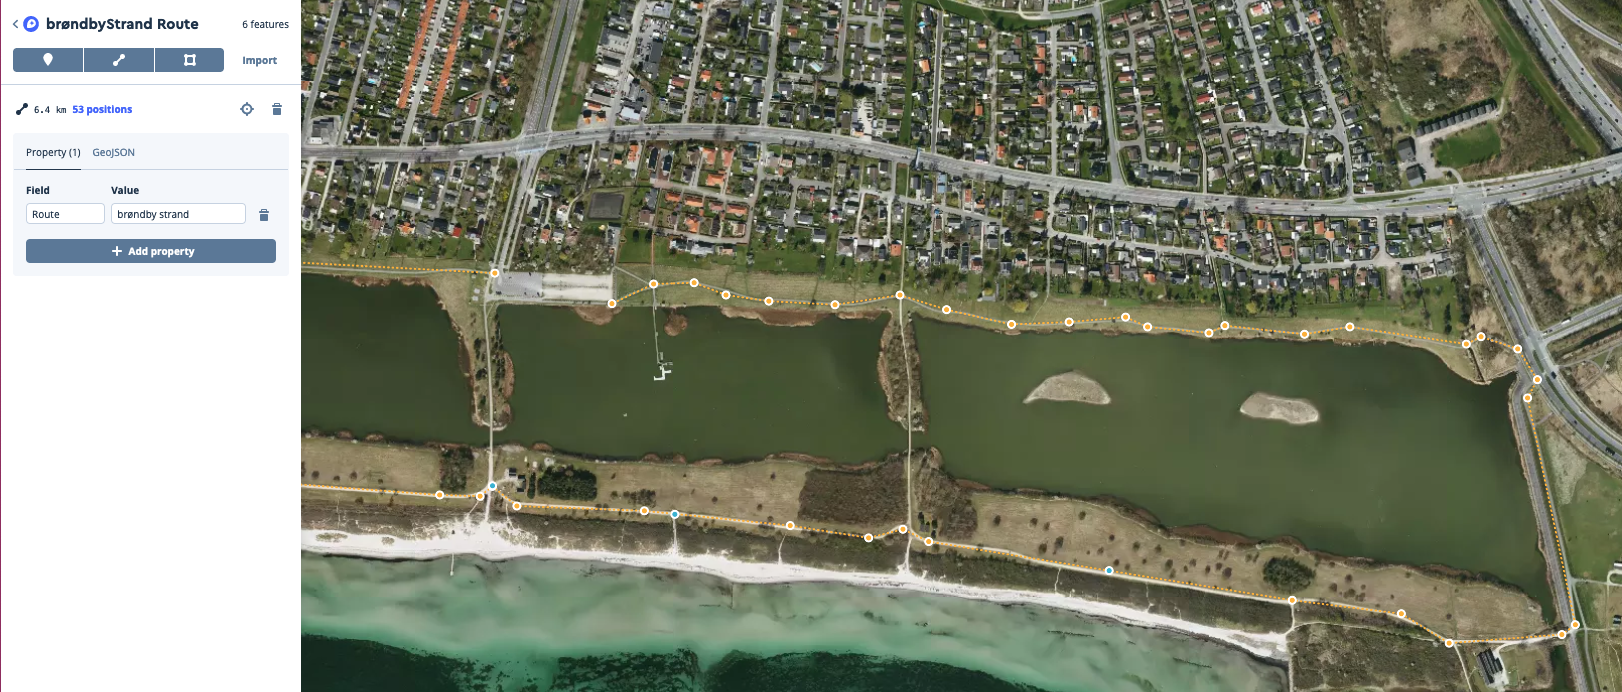
- Create a new dataset: https://studio.mapbox.com/datasets/
- Draw a line: Add Property: Field: Route, Value; Route Broendby Strand
- Draw the points: Add Property: Field: PoI, Value; (point of interest. fx. Outdoor gym)
- Save and export (right top corner)
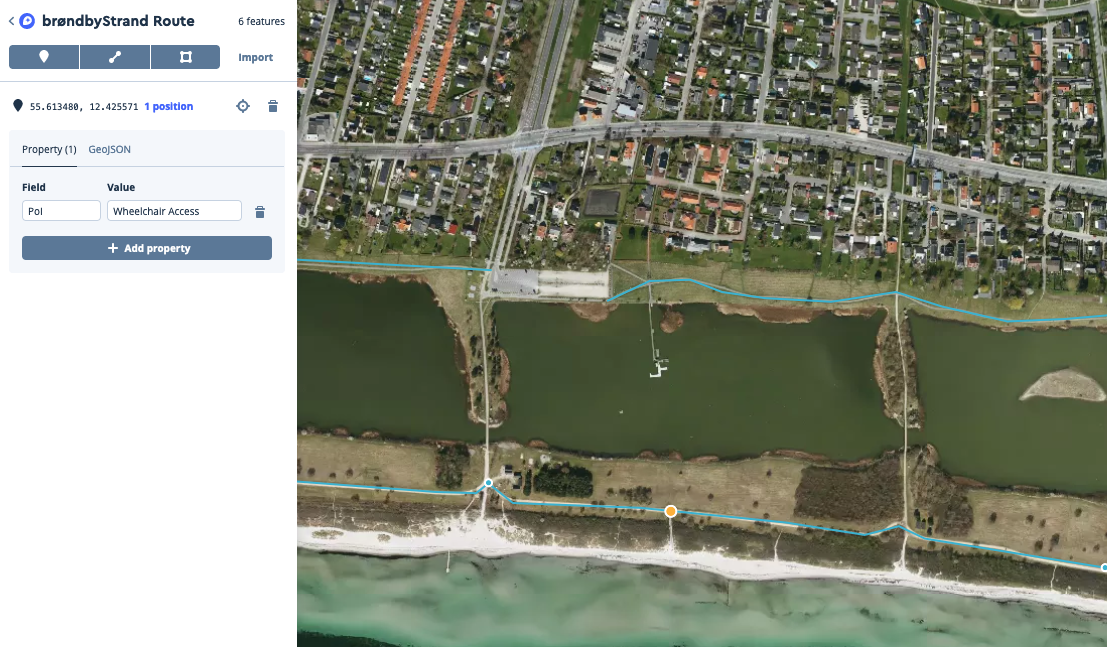
- Add your data to your style. On Mapbox Studio, Styles -> Layer-> Add new Layer -> Source - > find your dataset. If you have a line and points you need to make to layers, one for points and one for the line. For the points you want to make sure you only show the PoI. You do this by making a filter. See how in picture above:
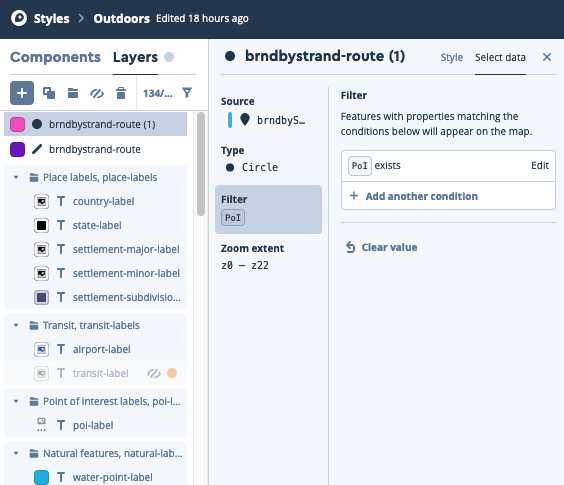
- You can now style your map as you wish.
Part II - Add interactivity
- In p5js start a new project.
- We will use the mappa.js library to handle the Mapbox GL API. Find the code on github, download the file and add it to your project. Don't forget to make a reference to it in the index.html file, inside the head tag:
  <head>
    <script src="https://cdnjs.cloudflare.com/ajax/libs/p5.js/1.2.0/p5.js"></script>
    <script src="https://cdnjs.cloudflare.com/ajax/libs/p5.js/1.2.0/addons/p5.sound.min.js"></script>

     <script src="mappa.js" type="text/javascript"></script>

    <link rel="stylesheet" type="text/css" href="style.css">
    <meta charset="utf-8" />

  </head>
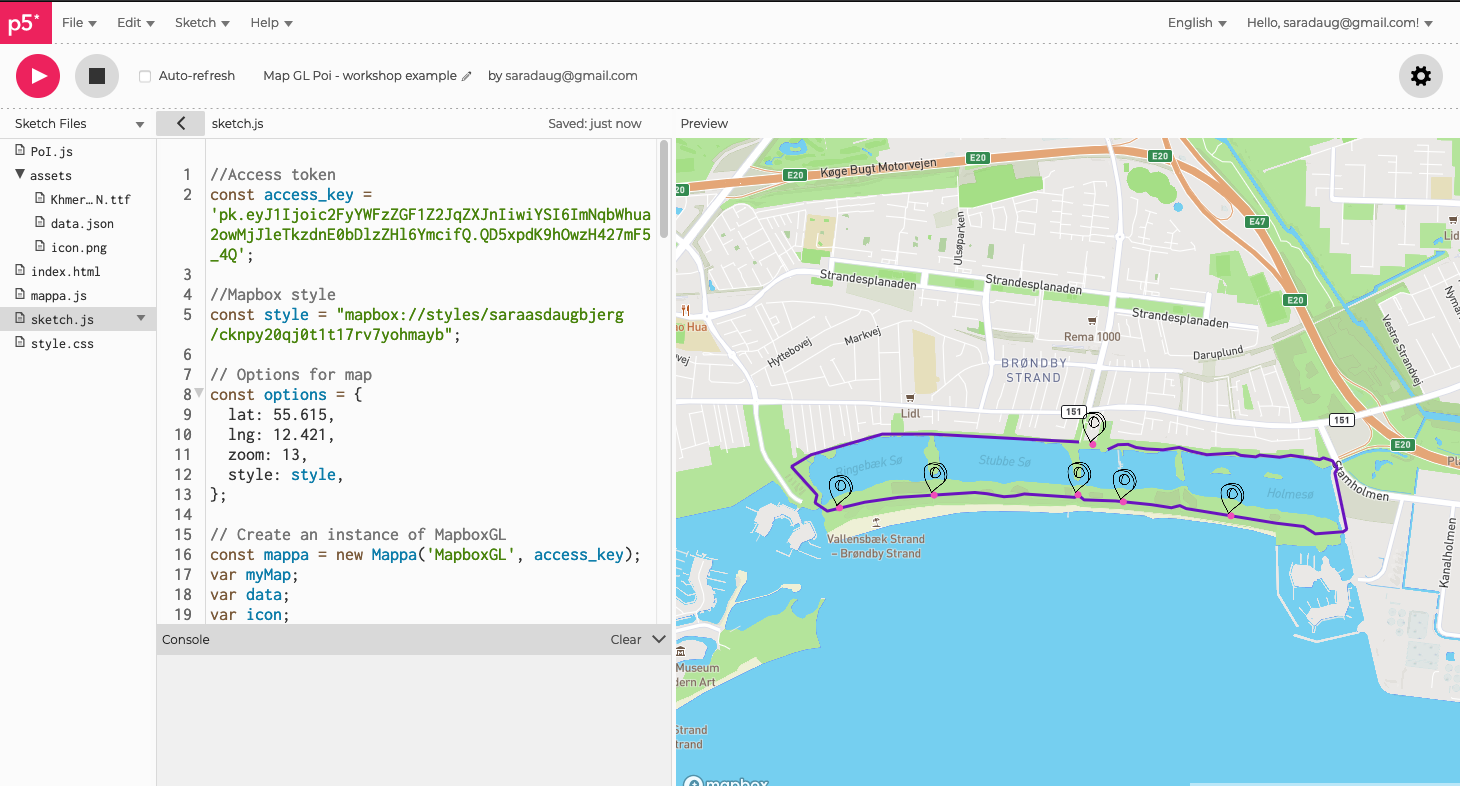
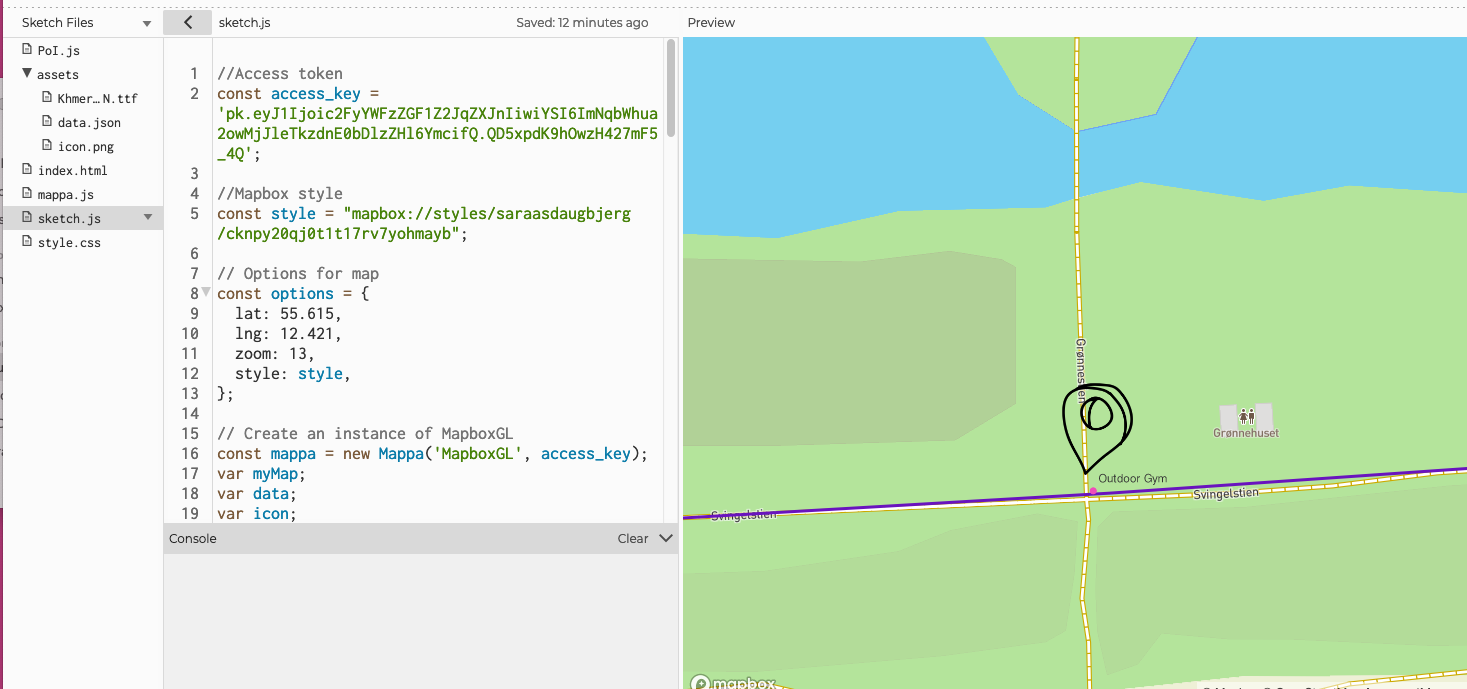
- Create a Mapbox GL instance. To make a new map instance you need to define your access token and your Mapbox style as variables. You also need to define a couple of options as bellow. Thereafter you can create an instance of Mapbox GL.
Copy this code in to your script.js file. If you change the token, style and the options parameters and run the code you will see your map on the preview window of p5js.
In Mapbox studio in the Settings menu you can see the coordinates and zoom of your map.
//Access token
const access_key = 'pk.eyJ1Ijoic2FyYWFzZGF1Z2JqZXJnIiwiYSI6ImNqbWhua2owMjJleTkzdnE0bDlzZHl6YmcifQ.QD5xpdK9hOwzH427mF5_4Q';

//Mapbox style
const style = "mapbox://styles/saraasdaugbjerg/cknpy20qj0t1t17rv7yohmayb";

// Options for map
const options = {
  lat: 55.615,
  lng: 12.421,
  zoom: 13,
  style: style,
};

// Create an instance of MapboxGL
const mappa = new Mappa('MapboxGL', access_key);
let myMap;

function setup() {
  canvas = createCanvas(windowWidth, windowHeight);
  // Create a tile map and overlay the canvas on top.
  myMap = mappa.tileMap(options);
  myMap.overlay(canvas);
}

function draw() {

}
Read data into p5js
- We will use the dataset we created in Mapbox to create interactive PoI in p5js. You can download your data in https://studio.mapbox.com/datasets/ by clicking on the tree dots by your dataset.
- The file is a geojson. You need to convert it to json, to be able to read it in p5js. Just rename the file from "file.geojson" to "file.json".
- Add the data to you p5js project as a file.
Reference: https://p5js.org/reference/#/p5/loadJSON
See this example: https://p5js.org/examples/advanced-data-load-saved-json.html
For every PoI in our data we now want to create an object that represents our PoI with the coordinates we get from the json file. Frist we create a class named PoI and after we write a method for extracting latitude and longitude from the json file and attribute it to the new object. Note that in geojson notation longitude comes first, not latitude as usual.
- Create a file called PoI.js, add it to the index.html
- Every object of this class will have a range of parameters, and methods for checking if mouse is over the PoI point (over()), showing the PoI (show()), and updating the position if the mapped is moved by the user (updatePos()).
class PoI {
  constructor(lat,lng, x, y, w, h, title) {
    this.lat = lat;
    this.lng = lng;
    this.x = x;
    this.y = y;
    this.w = w;
    this.h = h;
    this.title = title;
  }

  over(px, py) {
    let d = dist(px, py, this.x, this.y);
    if (d < this.w) {
      this.y = this.y-10;
      textSize(12);
      fill(50);
      text(this.title,this.x,this.y);
    }
  }

  show() {
    stroke(255);
    //fill(color);
    imageMode(CENTER);
    image(icon,this.x,this.y-this.h/2,this.w,this.h);

  }

  updatePos(_x, _y, _zoom) {
    //adjust if map is moved
    let zoomExpWidth = map(_zoom,0,22,0,5);
    let zoomExpHeight = map(_zoom,0,22,0,5);
    this.x = _x;
    this.y = _y;
    this.w = exp(zoomExpWidth);
    this.h = exp(zoomExpHeight);

  }

}
- Here we load the lat and long data from the json file and store it in an object PoI for every PoI point.
function loadPoiCoord() {

  var pois = data['features']; // Create an object that contains the features.

  //iterate trough the pois object. If it contains a PoI transform the latitude and longitude to pixels, and create a new instance of the class PoI
  for (let i = 0; i < pois.length; i++) {

    if (pois[i].properties.PoI) {

      var pos = myMap.latLngToPixel(pois[i].geometry.coordinates[1], pois[i].geometry.coordinates[0]);

      var poi = new PoI(
        //lat, lng, x, y, w, h, title
        pois[i].geometry.coordinates[1],
        pois[i].geometry.coordinates[0],
        pos.x,
        pos.y,
        iconWidth,
        iconHeight,
        pois[i].properties.PoI
      );

      poiPoints.push(poi);
    }
    loaded = true;
  }
}
Finally, in the method draw(), that runs repetitively, we iterate through the poiPoints array and show all the PoI points.
Here we make sure the data is loaded, that the map is ready and if these conditions are true we show every PoI instance and make sure their position is updated.
function draw() {
  clear();
  if (myMap.ready && !loaded) {
    loadPoiCoord();
  }

  if (loaded) {

    for(let i=0; i<poiPoints.length; i++){

      var pos = myMap.latLngToPixel(poiPoints[i].lat, poiPoints[i].lng);

      poiPoints[i].updatePos(pos.x,pos.y, myMap.zoom());
      poiPoints[i].over(mouseX,mouseY);
      poiPoints[i].show();

    }
  }
}
Full code her:
https://editor.p5js.org/saradaug@gmail.com/sketches/Oj-VPNUeG
Share your map
You can share your map as a page or embed into a webpage. In p5js go to file->share here you will find the links for sharing and embedding.
Secure your data and map
You might want to secure your data and access tokens. Read how here:
https://docs.mapbox.com/help/troubleshooting/how-to-use-mapbox-securely/
Any questions or comments write to Sara (sasd@ruc.dk)